Monitoring system performance is essential for maintaining a healthy Unix environment. Whether you’re checking CPU usage, memory consumption, or disk I/O, understanding how to monitor and troubleshoot your system can help you prevent issues and optimize resource usage.
This blog will guide you through some of the most useful tools and commands to monitor system performance in Unix, including CPU, memory, disk usage, and process monitoring.
1. How to Check CPU Usage with top and htop
The top command is a powerful tool to display real-time information about running processes, CPU usage, memory usage, and system load. It updates periodically and gives you a snapshot of your system’s performance.
Basic Syntax
topOnce the top command is running, you’ll see a list of active processes and resource usage statistics. The most important columns to watch are:
- %CPU: The percentage of CPU being used by each process.
- %MEM: The percentage of memory being used by each process.
- LOAD: The system load averages for the past 1, 5, and 15 minutes.
You can interact with top using the following keys:
q: Quit the program.P: Sort by CPU usage.M: Sort by memory usage.
Advanced: Using htop
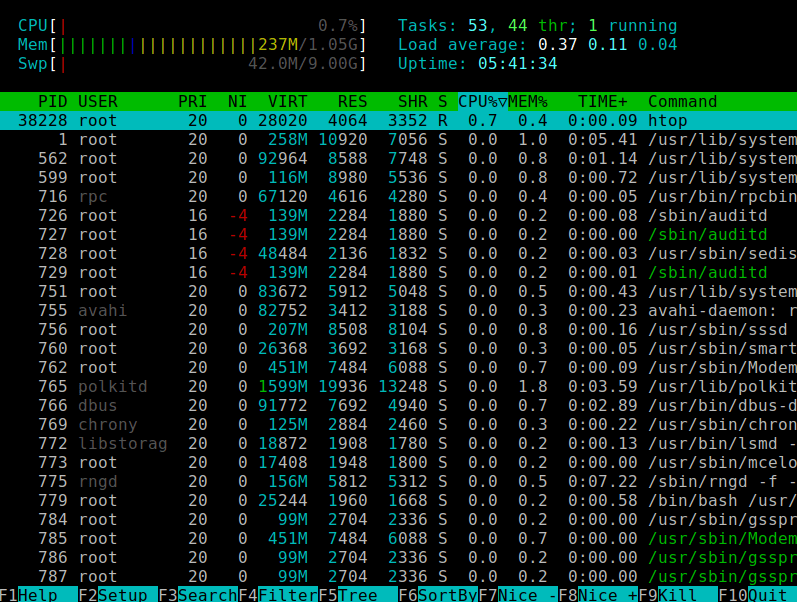
htop is an interactive version of top that is more user-friendly and visually appealing. It shows system metrics in a color-coded format and allows you to interact with processes.
To install htop:
$ sudo apt install htop  # On Ubuntu/Debian
$ sudo yum install htop  # On CentOS/Red Hat
To run htop:
$ htop2. How to Monitor Memory Usage with free and vmstat
Using free
The free command shows you the current memory usage, including both physical and swap memory. It is a quick and easy way to check your system’s memory status.
Basic Syntax
free -hThe -h option displays memory sizes in human-readable format (e.g., MB, GB).
Example Output:
              total        used        free      shared  buff/cache   available
Mem:           16G          3G         10G         1G          3G         12G
Swap: 4G 0G 4G- Used: Memory currently used by processes.
- Free: Unused memory.
- Buff/Cache: Memory used for buffering and caching data.
- Available: Memory available for starting new applications without swapping.
Using vmstat
The vmstat (virtual memory statistics) command provides more detailed information about memory, processes, paging, block IO, and system performance.
Basic Syntax
vmstat 1This will display system statistics every second. Key fields to watch:
r: The number of processes waiting for CPU time.free: Amount of free memory.si: Swap in (memory being moved from disk to RAM).so: Swap out (memory being moved from RAM to disk).
3. How to Monitor Disk Usage with df and du
Using df
The df command is used to check disk space usage for mounted filesystems. It gives an overview of the available and used space on each filesystem.
Basic Syntax
df -hThe -h option displays the output in human-readable format (e.g., GB, MB).
Example Output:
Filesystem      Size  Used Avail Use% Mounted on
/dev/sda1       50G   25G   20G  60% /
/dev/sdb1 100G 40G 55G 43% /data- Size: Total size of the filesystem.
- Used: Amount of space used.
- Avail: Available space.
- Use%: Percentage of disk space used.
- Mounted on: Mount point of the filesystem.
Using du
The du command shows disk usage for directories and their contents. It’s useful when you want to find out how much space a particular directory is consuming.
Basic Syntax
du -sh /path/to/directory-s: Show only the total size for the directory.-h: Human-readable format.
Example Output:
$ du -sh /home/user
1.5G    /home/user
4. How to Monitor Process Usage with ps and pgrep
The ps (process status) command displays information about active processes, such as the process ID (PID), memory usage, and CPU usage.
Basic Syntax
ps auxa: Show processes of all users.u: Show user-oriented format (including memory and CPU usage).x: Show processes without a controlling terminal.
Example Output:
USER       PID %CPU %MEM    VSZ   RSS TTY      STAT START   TIME COMMAND
user      1234  0.3  1.2  34567 12345 ?        Ss   10:00   0:05 /usr/bin/python3
Using pgrep
The pgrep command allows you to search for processes by name and get their process IDs.
Basic Syntax
pgrep process_name- Example: Find the PID of all running
pythonprocesses:
$ pgrep python5. How to Check System Load with uptime and w
The uptime command provides a simple way to check how long the system has been running, along with the current system load averages.
Basic Syntax
uptimeExample Output:
10:12:34 up 5 days, 2:34, 2 users, load average: 0.12, 0.10, 0.08- Load average: The system load averages for the past 1, 5, and 15 minutes.
- Up time: How long the system has been running.
The w command is similar but provides additional information, such as who is logged in and what they are doing.
Basic Syntax
wExample Output:
 10:12:34 up 5 days,  2:34,  2 users,  load average: 0.12, 0.10, 0.08
USER     TTY      FROM             LOGIN@   IDLE   JCPU   PCPU  WHAT
user     pts/0    192.168.1.1      09:30    1.00s  0.10s  0.01s  w
6. How to Monitor System Logs with journalctl
The journalctl command is used to query and display logs from the systemd journal, which contains logs for system processes, kernel events, and other system activities.
Basic Syntax
journalctlExamples:
- View logs from the current boot:
$ journalctl -b- View logs related to a specific service:
$ journalctl -u nginx- Follow logs in real-time:
$ journalctl -fPractice Time!
- Monitor CPU and Memory Usage:
- Use
toporhtopto check CPU and memory usage and monitor processes.
- Check Disk Space:
- Use
dfto view available disk space andduto check the disk usage of specific directories.
- Monitor Processes:
- Use
psto examine active processes andpgrepto find specific processes.
- Check System Load:
- Use
uptimeandwto check the system load and logged-in users.
- Review System Logs:
- Use
journalctlto view logs and troubleshoot any system issues.
Summary
- How to use
topandhtopto monitor CPU and memory usage. - How to use
dfandduto monitor disk space and disk usage. - How to use
psandpgrepto monitor and manage processes. - How to use
uptimeandwto check system load and user activity. - How to use
journalctlto review system logs.


